

Formulas and Pivot Tables
Unlocking the Power of Excel for Data Analytics

In the world of data analytics, Excel remains one of the most versatile and widely used tools. Its simplicity, combined with powerful formulas, makes it an essential skill for anyone working with data. Whether you're a beginner or an experienced analyst, mastering Excel formulas can significantly enhance your ability to analyze, visualize, and interpret data. In this blog, we’ll explore some of the most essential Excel formulas used in data analytics and how they can help you derive meaningful insights from your data. Also, provides the brief introduction to Pivot tables.
1. Formulas: The Basics
Below are few foundational formulas that are the building blocks of data analysis.
SUM: Adds up a range of numbers.
Example: =SUM(I2:I11) adds all values in cells I2 through I11.

AVERAGE: Calculates the mean of a range of numbers.
Example: =AVERAGE(I2:I11) gives the average of values in cells I2 through I11.

COUNT: Counts the number of cells in a range that contains numbers.

Example: =COUNT(I1:I11) counts how many cells in I2 through I11 contain numeric values.
Running the same formulae on nonnumeric data will lead to a result of 0. [Shown above as Count(Address) populated in cell G15.
The Sum, Count, Average formulas are perfect for quick calculations and summaries, but the world of formulas is huge. The following are few categories of formulas supported by Excel.
1. Mathematical and Trigonometric Formulas: Perform basic and advanced mathematical operations.
Examples: SUM, AVERAGE, ROUND, SQRT, SIN, COS, TAN
2. Statistical Formulas: Analyze and summarize data statistically.
Examples: COUNT, COUNTIF, MAX, MIN, STDEV
3. Logical Formulas: Evaluate conditions and return results based on logical tests.
Examples: IF, AND, OR, NOT
4. Lookup and Reference Formulas: Retrieve data from specific locations in a dataset.
Examples: VLOOKUP, HLOOKUP, INDEX, MATCH, XLOOKUP
5. Text Formulas: Manipulate and analyze text data.
Examples: CONCATENATE (or CONCAT), LEFT, RIGHT, MID, LEN, TRIM
6. Date and Time Formulas: Work with dates and times.
Examples: TODAY, NOW, DATEDIF, (YEAR, MONTH, DAY), EOMONTH
7. Financial Formulas: Perform financial calculations and analysis.
Examples: PMT, FV, PV, NPV, IRR
8. Database Formulas: Analyze and summarize data in database-like formats.
Examples: DSUM, DAVERAGE, DCOUNT
9. Information Formulas: Provide information about the data or cells.
Examples: ISBLANK, ISERROR, ISTEXT, CELL
10. Array Formulas: Perform calculations on multiple values simultaneously.
Examples: SUMPRODUCT, TRANSPOSE, Dynamic Array Formulas (FILTER, SORT, UNIQUE)
11. Engineering Formulas: Perform engineering-related calculations.
Examples: CONVERT, BIN2DEC, HEX2DEC
12. Cube Formulas: Work with data models and OLAP (Online Analytical Processing) cubes.
Examples: CUBEVALUE, CUBEMEMBER, etc.
13. Web Formulas: Retrieve data from the web or work with URLs.
Examples: WEBSERVICE, FILTERXML, etc.
We will be covering all these categories in detail in the next blog post.
2. Pivot Tables
Pivot tables offer several advantages over traditional formulas in Excel, especially when it comes to data analysis and reporting. Here are 5 key advantages of pivot tables compared to formulas:
1. Ease of Use and Speed
Pivot Tables: Create summaries and calculations with a few clicks using drag-and-drop functionality. No need to write complex formulas.
Formulas: Require manual entry of functions (e.g., SUMIF, VLOOKUP, INDEX/MATCH), which can be time-consuming and error-prone, especially for large datasets.
2. Dynamic Data Analysis
Pivot Tables: Allow you to quickly rearrange, filter, and group data dynamically. You can explore different views of the data without rewriting formulas.
Formulas: Static and require manual adjustments if the data structure or analysis requirements change.
3. Handling Large Datasets
Pivot Tables: Optimized for large datasets and can process thousands of rows efficiently without slowing down Excel.
Formulas: Complex formulas (e.g., array formulas) can slow down Excel when applied to large datasets, especially if multiple calculations are involved.
4. Automatic Updates
Pivot Tables: Automatically update calculations and summaries when the source data changes (with a simple refresh).
Formulas: Require manual updates or adjustments if the source data changes, which can lead to errors or inconsistencies.
5. Built-in Aggregation and Grouping
Pivot Tables: Provide built-in tools for summarizing data (e.g., sums, averages, counts) and grouping data (e.g., by date ranges, categories, or custom groups).
Formulas: Require separate formulas for each aggregation or grouping, which can become cumbersome and difficult to manage.
Below are few snippets of the pivot tables created for the same dataset above.
Pivot table 1: Summarizing the sum of Salaries from each job category

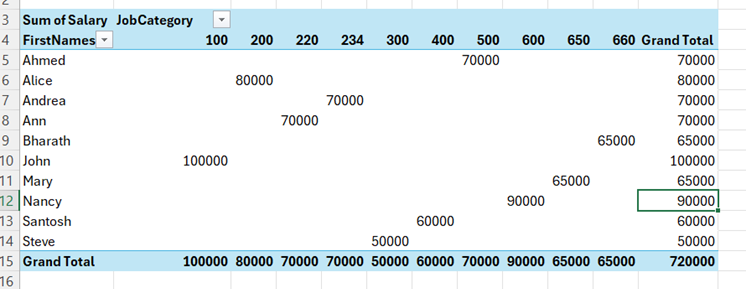
Pivot Table 2: Introducing another variable (Gender) into Total Salary Summary

Pivot Table 3: Average Salary data across summarized across Gender and Job Categories

Pivot Fields for Pivot table 1
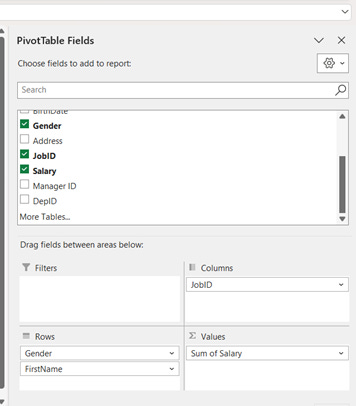
Pivot Fields for Pivot Table 2

Pivot Fields for Pivot Table 3
Instead of using multiple formulas, we were able to generate so many different types of views with just few clicks using pivot table.
Summary:
Pivot tables are more user-friendly, efficient, and flexible for data analysis compared to formulas. They save time, reduce errors, and make it easier to explore and present data insights. Formulas, while powerful, are better suited for specific, one-off calculations rather than large-scale data analysis.
PS: Now, one question for the readers, did you find out the mistake in the screenshots. Do drop in your comments if you were able to find that out.